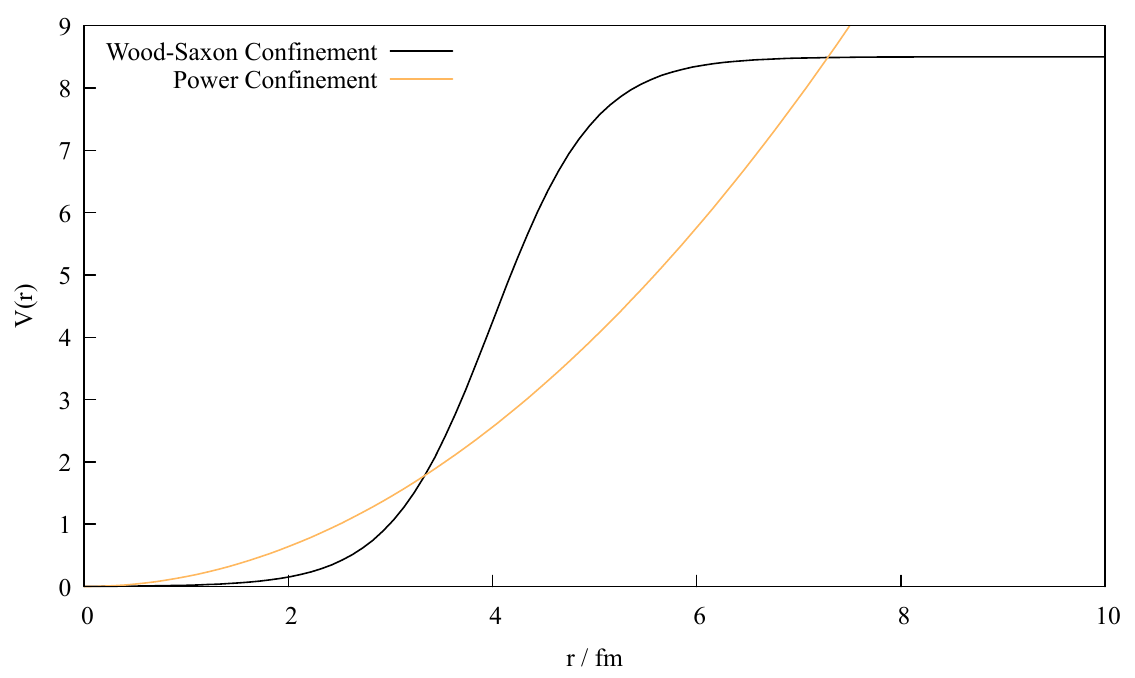
Gnuplot template for pdf plots (resulting example plot shown below):
Code
#!/usr/bin/gnuplot reset# plot a pdfset terminal pdfcairo enhanced font "Times New Roman,12.0" roundedset output 'confinement_plot.pdf'set border linewidth 1.0set size ratio 0.55# set plot line stylesset style line 1 linecolor rgb 'black' linetype 1 linewidth 1set style line 2 linecolor rgb '#FFB85F' linetype 1 linewidth 1#yellow# set legend positionset key left top# set axis propertiesset ylabel 'V(r)'set xlabel 'r / Bohr'set xtics nomirrorset ytics nomirrorset xr[0:10]set yr[0:9]#variables w =8.5 r0 =4.0 a =2.0 r1=2.5#functions f (x) = w / ( 1+ exp (a * (r0 - x))) g (x) = (x/r1)**2# plot funcitons plot f(x) title 'Wood-Saxon Confinement' w lines linestyle 1, \ g(x) title 'Power Confinement' w lines linestyle 2### for plotting data files:# plot "name_of_datafile.dat" w lines
Set background color to white (a good .vmdrc file is shown in the appendix)
Adjust camera to a nice perspective of the molecule and set the resolution of atoms and bonds in graphical representations to 25
File -> Render ...
Select "Tachyon"
add to the the command before the -o flag "-res 3000 3000" so that i looks like "... TARGA -res 3000 3000 -o ..."
autocrop and scale the image to a smaller size it with gimp, done!
Good default VMD settings (stolen from Bernhard, copy content end save it in .vmdrc in your home directory):
Code
color Display Background white color Axes Labels black color Labels Bonds black color Labels Angles black display depthcue off## position and turn on menus menu main move 5225 menu display move 39530 menu graphics move 395500 menu main on menu graphics on mol delrep 0 top mol representation Licorice 0.10000012.0000001.000000 mol addrep top mol representation DynamicBonds 1.6000000.10000012.000000 mol addrep top